The travelling salesperson, by genetic algorithm
Thirteen US cities, a browser worker, and a genetic algorithm that gets within a few hundred miles of the optimum in twenty-one generations.
Given a list of cities and the distances between each pair of them, what is the shortest route that visits every city and returns to where it started? That is the travelling salesperson problem, and it is why your delivery route is not planned by hand.
The constraints here: thirteen cities, no city visited twice, and the route has to close. New York is the starting point, which makes no difference to the answer but makes the picture easier to read.
The distances come from the Google OR-Tools TSP example — Euclidean distance, not road distance, so the geography is honest about direction and optimistic about driving.
| City | Coordinates | Letter |
|---|---|---|
| New York | 40, -74 | A |
| Los Angeles | 34, -118 | B |
| Chicago | 41, -87 | C |
| Minneapolis | 44, -93 | D |
| Denver | 39, -104 | E |
| Dallas | 32, -96 | F |
| Seattle | 47, -122.33 | G |
| Boston | 42, -71 | H |
| San Francisco | 37, -122.41 | I |
| St. Louis | 38, -90 | J |
| Houston | 29, -95 | K |
| Phoenix | 33, -111.07 | L |
| Salt Lake City | 40, -111.89 | M |
In 2019 the tool I reached for was a genetic algorithm, running in a web worker. A worker matters here: the search takes a few seconds, and doing it on the main thread freezes the page while it runs.
Loading the demo…
Population 20, mutation rate 0.2. The GA stops when it stops improving, so a run is usually about twenty generations — and a different twenty each time. Best tour is the accent line, average the cool one.
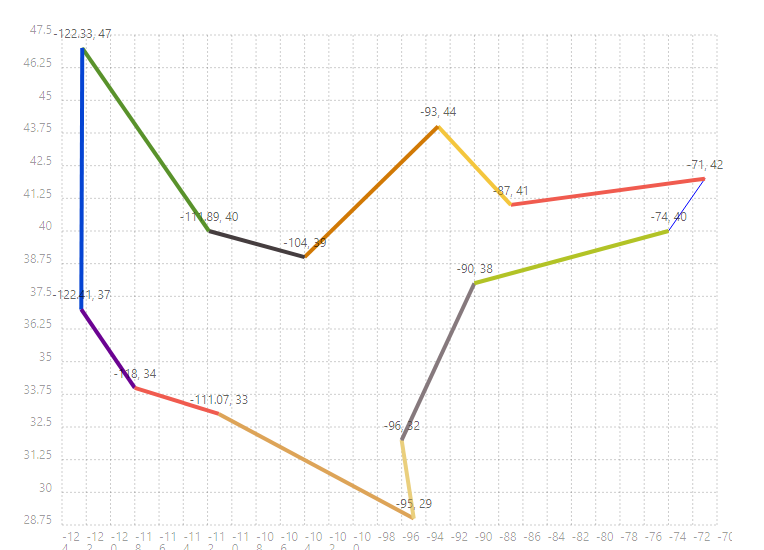
The proven optimum for this matrix is 7,293 miles: New York → Boston → Chicago → Minneapolis → Denver → Salt Lake City → Seattle → San Francisco → Los Angeles → Phoenix → Houston → Dallas → St. Louis → New York. The genetic algorithm does not find it. It finds something a few hundred miles worse, quickly and every time — which is the honest trade for a problem where the exact answer costs factorial time.
Watch the random selection option in particular. It degrades towards a random search, because selecting parents without regard to fitness throws away the pressure that makes the search work at all.
What it taught me
- The earth is not flat, and charts are worse than they look. Plotting longitude against latitude means swapping them and remembering the y-axis points down. Most chart APIs also refuse to let you set both axes at once — which is exactly what a map needs.
- SVG is the right output for this, and getting an API to emit it is usually worth more than the API's presets.
- Benchmark data sets exist for this problem, so an implementation can be measured instead of admired.
- A mutation rate that is too high turns a GA into a random search. It is the first knob to turn, and the wrong direction to turn it.
- A worker is the difference between a page and a spinner. The search is seconds of solid CPU; the UI does not have to pay for it.
Bye.
Written in 2019, ported from the old Hugo site and lightly edited. The demo was redrawn in plain SVG in 2026; the algorithm is the same worker file it always was.
Comments
Discussion lives on GitHub — you'll need a GitHub account to post.