Nearest neighbour on a map
A Voronoi diagram turns the most common question you can ask a map into a region lookup. Two live diagrams, one of them clickable.
Most questions you ask a map are really the same question: what is nearest? Nearest station, nearest shop, nearest cell tower, nearest anything.
Take the fire station. You have one to place, and you want it to serve as many addresses as possible. Every address belongs to whichever station is closest to it, so the first thing you need is a way to ask "who is closest?" for every point on the map at once. That is what a Voronoi diagram gives you: the plane is cut into one region per point, and each region is exactly the set of positions closer to that point than to any other.
Thirty random points, their regions, and the triangulation they came from. The 2019 version asked you to reload the page for a new diagram; a button is cheaper.
The whole first diagram is four lines once the points exist. The geometry comes from d3-delaunay, which is the one part of the old d3 stack still carried here — everything else about the old post was drawing.
var delaunay = d3.Delaunay.from(vertices);
var voronoi = delaunay.voronoi([0, 0, SIZE, SIZE]);

svg.appendChild(el("path", { class: "d-mesh", d: voronoi.render() }));
svg.appendChild(el("path", { class: "d-mesh", d: voronoi.renderBounds() }));
svg.appendChild(el("path", { class: "d-point", d: delaunay.renderPoints() }));
The query
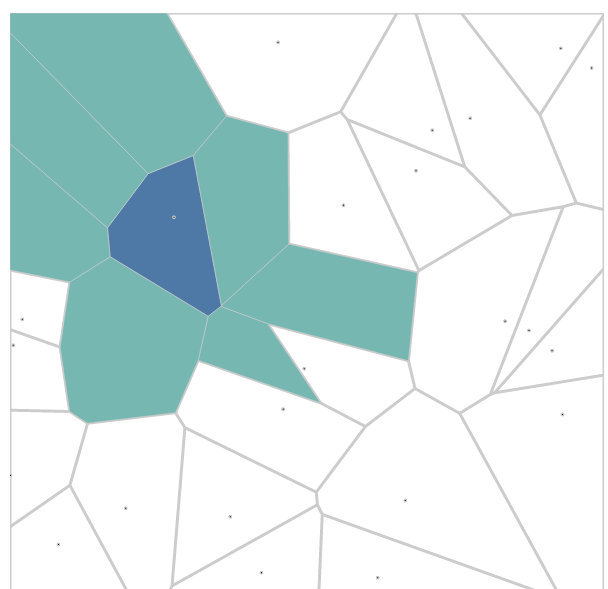
Now the interesting half. The triangulation knows which regions touch which, so a nearest-neighbour query is a region lookup and a neighbour query is a walk over the edges of that region:
var nearest = delaunay.find(x, y);       // the region the point fell into
var neighbours = delaunay.neighbors(nearest);

cell(svg, voronoi, nearest, "d-nearest");
neighbours.forEach(function (index) {
  cell(svg, voronoi, index, "d-neighbour");
});

function cell(svg, voronoi, index, className) {
  svg.appendChild(el("path", { class: className, d: voronoi.renderCell(index) }));
}
The eight cities below are the ones from the travelling salesperson post, so their positions should look familiar.
Loading…
Click anywhere. The accent region belongs to the city nearest to that point; the cooler regions share a Delaunay edge with it. That shared edge is the whole trick — cities whose regions touch are exactly the pairs that are adjacent on the map.
What it taught me
- The learning curve on d3 is genuinely steep, and most of it is spent on the drawing rather than the data structure underneath.
- Voronoi is not the hard part. Once the triangulation exists, the regions and the neighbour lists fall out of it.
neighboursin a triangulation means adjacent, not k-nearest. They are different queries, and conflating them is easy until a reader tries to search for "the three nearest" and gets two cities on the other side of the country.- Iterate the edges explicitly rather than the region list —
for...ofover what the triangulation hands back is enough. MDN on iterators and generators. - Make the SVG responsive once, with a
viewBox, instead of per-diagram sizes. A short write-up on that. - Queries are cheap; changes are not. Building the triangulation once and asking it thousands of questions is the deal. Move the points and the structure has to be rebuilt, so a map where things move is a data structure problem, not a drawing one.
Bye.
Written in 2019, ported from the old Hugo site and lightly edited. The demos were redrawn in plain SVG in 2026; the geometry is still d3-delaunay, which is the only d3 left on the page.
Comments
Discussion lives on GitHub — you'll need a GitHub account to post.